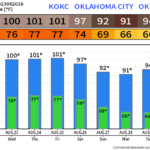
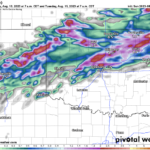
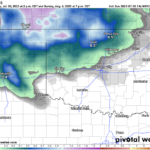
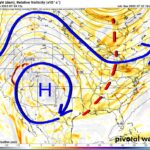
Before we get to that last part of the title, let’s take a quick look at the impressive 2015/21016 El Nino which was the 3rd strongest in recent history.

The Oceanic Niño Index (ONI) shows warm (red) and cold (blue) phases of abnormal sea surface temperatures in the tropical Pacific Ocean

The Oceanic Niño Index (ONI) shows warm (red) and cold (blue) phases of abnormal sea surface temperatures in the tropical Pacific Ocean

Team Tuttle Realty

Buy or Sell today with Results That Move You!

El Nino is just the warming of the ocean water across a specific equatorial zone in the Pacific.
El Nino region in the Pacific.

El Nino region in the Pacific highlighting the warm water.

It is divided up into sections with 3.4 given the most weight with respect to global affects in both weather patterns and temperature.
ENSO Regions.

ENSO regions divided into sections.

All Comfort Specialist

As you can see by the animation, the above normal oceanic water temperature continues to decrease rapidly.
Animation of El Nino decay.

Animation of El Nino decay.

Here is the current state of the ocean temperatures at the surface. Below this layer is a large swell of cold water moving upwards to the surface.

Ferguson Roof Systems is offering an AT's Weather special, Call Today!

Current state of ocean temps.

Current state of ocean temps.

The forecast models not only show the demise of the El Nino but a rapid resurgence of the La Nina to take its place. Same ocean region, but this time water temperatures much below normal.
Sea surface temperatures forecasted to drop below normal during the summer.

Sea surface temperatures forecasted to drop below normal during the summer JJA (June/July/August).


Forecast showing the fall of the El Nino (green) and rise of the La Nina (blue).

Forecast showing the fall of the El Nino (green) and rise of the La Nina (blue).


Scripps model calling for a Super La Nina.

Scripps model calling for a Super La Nina by next winter.


Model forecast of La Nina this Fall.

Model forecast of La Nina this Fall.


Now that we know we’re going from a strong Nino to a strong Nina, what is the influence of each? Well, with a strong or super El Nino you get a quick spike in global temperatures. So when you heard recently that it was the warmest winter/year in recent recorded history, just know it was only that way because of El Nino, not because mankind all of sudden did something to cause it. On the flip side, once La Nina gets going you’ll see the global temperatures fall once again, although there will be a lag to it. By the end of 2016 you’ll definitely see it in the data. This is the yin and yang of the ENSO and global temperature. The graph below shows the correlation in global temps and the ENSO (El Nino or La Nina). It also shows how volcanic eruptions can cool down temperatures as well.
Global temperature and ENSO relationship. Temps fall during strong La Nina's and warm during strong El Nino's.

Global temperature (blue line) and ENSO (red) relationship. Temperatures fall during strong La Nina’s and warm during strong El Nino’s.

So what will La Nina mean for the country and specifically Oklahoma when it comes to severe weather? That’s where we get into the last part of our title. Yes we will see a large increase of tornadoes leading to outbreaks. At least that is what historically happens in our small data set going back to 1950. If we compare 2008 and 2011, which were strong La Nina periods, to other years across the country, we find the number of tornadoes were 800 and 500 respectively above the yearly average of 1400. In Oklahoma specifically, this meant 77 tornadoes in 2008 and 119 in 2011. This is well above the yearly average of 55 for the Sooner state.
Number of US tornadoes in recent years.

Number of US tornadoes in recent years.


Now who sees the most tornadoes is still up for debate. Two recent research studies indicate different parts of the country. The first one listed below shows a strong El Nino year on the top and a strong La Nina year on the bottom. You can see the effect across E OK and AR inside the red box. The second study below that shows that we’re going to have a little mix of everything. Yes El Nino is dying quickly as we head into May, which by the top right image indicates a greater number of tornadoes centered in northern half of Oklahoma. A weaker La Nina leads to April outbreaks in Oklahoma and Kansas, while a strong La Niña leads to April outbreaks along the Ohio Valley, the Southeast, and Upper Midwest which is what the lower left panel is indicating. Then you have the final La Nina influence that transitions back into an El Nino as producing another peak, bottom right panel.
When ENSO is in a hot, or El Niño, phase (top), the frequency of tornadoes goes down. When it is in a cold, or La Niña phase, tornadoes increase. The effect is strongest in the boxed area. Credit: Allen et al., Nature Geoscience, 2015

When ENSO is in a hot, or El Niño, phase (top), the frequency of tornadoes goes down. When it is in a cold, or La Niña phase, tornadoes increase. The effect is strongest in the boxed area. Credit: Allen et al., Nature Geoscience, 2015


Tornado outbreaks according to ENSO.

Tornado outbreaks according to ENSO.


So the bottom line is this. La Nina’s aren’t good for Oklahoma. Unless you want more tornadoes of course (enter every storm chaser here), then you are more than excited. This means our Spring of 2017 will be extremely active tornado wise, and then stay just a hair more active than normal for 2018 and 2019. So while I do expect a large increase in tornadoes next Spring, remember that most of those are small and weak and easily survivable. Make sure you read my other blog about Lilapsophobia which talks more about the fear of tornadoes and how to protect yourself.
Liked it? Take a second to support Aaron Tuttle on Patreon!
Become a patron at Patreon!